Homolmapper is a free, open-source application for mapping homology information from a protein sequence alignment onto a structure file, allowing one to examine homology in a structural context. Homolmapper is a command-line Python application written in the Lagarias lab at UC Davis. It is available under a license from The Regents found at the DOWNLOAD INSTRUCTIONS (BELOW). The structure must be in PDB format. The output is a new PDB file which can be readily examined in the structure-viewing program of one’s choice (the author of homolmapper prefers VMD).
CONTACT
Some support can be provided at “slow dog at you see davis dot e d u” once one reconstitutes an email address. Please include “homolmapper” in the subject line.
CITATION
Homolmapper users are asked to cite the following paper (available here) when using homolmapper in a published work as a matter of courtesy.:
Nathan C Rockwell and J. Clark Lagarias “Flexible mapping of homology onto structure with Homolmapper” BMC Bioinformatics 2007, 8:123 (11 April 2007) PMID: 17428344
DOWNLOAD HOMOLMAPPER
Requirements:
1. A Python executable (version 2.3 or later, including Mac framework builds). Windows users may also wish to install the win32 Python extensions (http://sourceforge.net/projects/pywin32), especially for running batch jobs with scoring imports.
2. CLUSTAL or some other means of generating CLUSTAL-format alignments.
3. A viewer that can visualize B factor, occupancy, SegID, and element fields to view the output.
Availability:
To read the license and download, follow this link.
EXAMPLES
These are a few examples illustrating some of the scoring schemes that homolmapper can produce. All views are from the User’s Guide, and all files are in the demo. The figures were prepared with VMD, using STRIDE (Frishman and Argos, 1995) for secondary structure assignment.
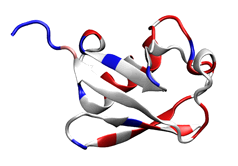
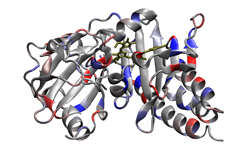
1. A simple identity scoring scheme applied to the ubiquitin structure (1UBQ; Vijay-Kumar et al. 1987). Blue indicates conservation (dark blue, 100% identical) and red indicates variability.
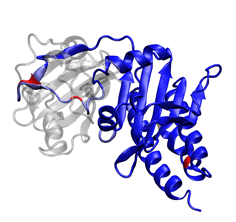
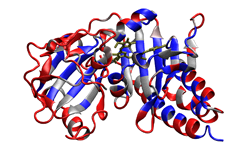
2. The photosensory core of the bacteriophytochrome DrBphP (1ZTU; Wagner et al. 2005). This structure has a PAS domain (left) and GAF domain (right) in a novel knotted architecture. The GAF domain is shown colored by frequency of insertions (dark blue, no insertions; red, insertions in ≥3% of the 122 sequences aligned).
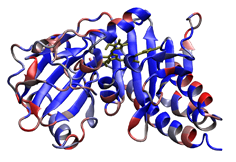
3. A scoring scheme based on a physical property (amino acid charge) applied to the phytochrome structure. On the left, conservation of charge is shown (negative, red; positive, blue). In the center, variability is assessed as range of charge at each position (blue, no variation; red, full range from -1 to +1 is observed). On the right, variability is assessed as standard deviation of the observed charges at each position in the alignment. Conserved lack of charge can be distinguished from variability.
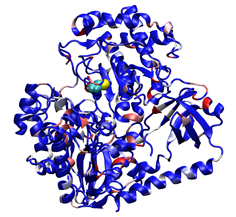
4. Scoring formate dehydrogenase (2IV2; Raaijmakers & Romao, 2006) using a custom, user-designed scoring scheme. The selenocysteine residue is recognized and scored in this example as well. Potential phosphorylation sites are highlighted in red.
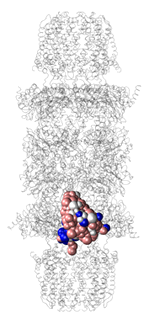
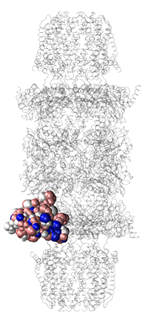
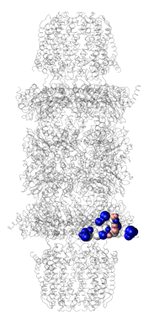
5. Using different matching choices allows the user to select different portions of the proteasome structure (1FNT; Whitby et al., 2000) for scoring. Left and center, different subunits were matched by choosing different sequences from the same alignment. Right, another sequence in the alignment did not match a single chain, but instead recognized a number of scattered sequences. Homolmapper can also match sequences automatically, without user input. In this case, the automatic result is identical to that on the left.
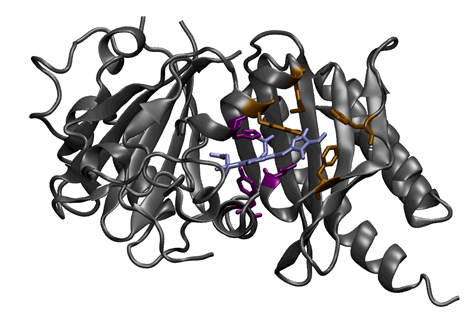
6. Locating specific sequence motifs on a known structure. Two motifs (bronze and purple) are mapped onto the phytochrome structure for visualization relative to the chromophore (light blue). The purple motif is present in 34.4% of the aligned sequences, and the bronze motif is found in 91.8%.
7. Detection of subfamily-specific residues of plant phytochromes. Known phytochromes from higher plants have a uniquely conserved Tyr residue not found in others. This Tyr was used to define the subfamily of higher plant phytochromes in the demo alignments. Subfamily-specific residues are shown colored by the type of residue found in plant phytochromes.
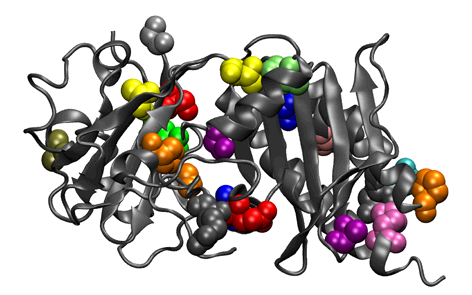
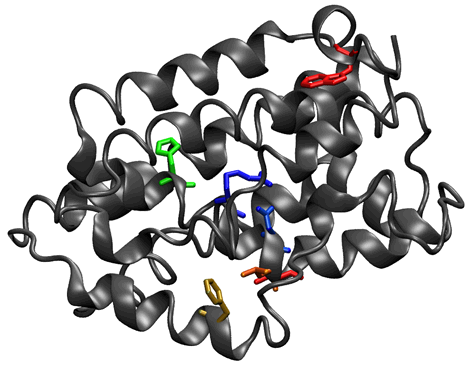
8. Mutual-information analysis of heme oxygenases. Heme oxygenase (1DVE: Sugishima et al, 2000) is shown with all residues having mutual-information scores 3.5 standard deviations above the mean for an alignment of 56 heme oxygenases displayed in stick-figure representation. The residues are color-coded by the sum of the significantly associated residue numbers.